 |
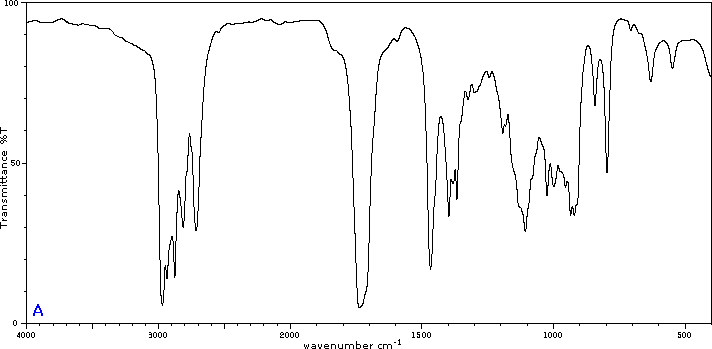
| An example of an infrared spectrum |
Need a guide to teach you how to read an infrared absorption spectrum graph (for infrared spectroscopy)? Well, look no further! This is a basic yet reliable way of determining which absorption peak on your graph correspond to which type of functional group/s that is/are present in your molecule. :) Have fun!
It's free to download and print on my Scribd account. Link: http://www.scribd.com/doc/199525583/When-You-Analyze-the-Spectra
Credits to my chemistry lecturer for teaching us this.
No comments:
Post a Comment